You can configure the colors used to represent maps, topics, images,
and resources on statistics pie charts available through the Project Management
view.
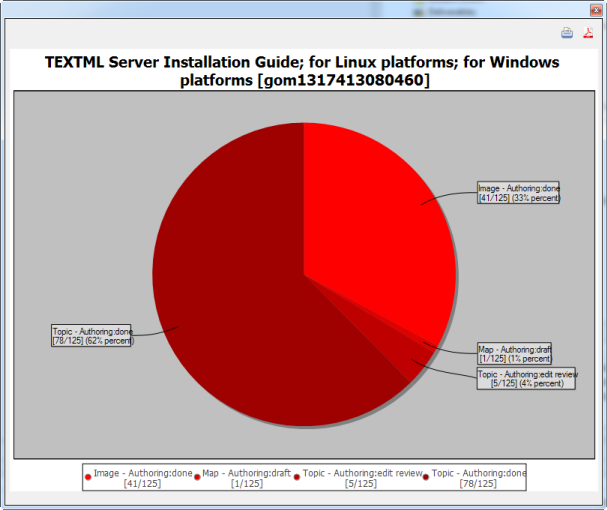
If you do not specify colors, red is used by default.Figure: A statistics pie chart
To configure the pie chart colors:
Open the TEXTML Administration perspective by clicking the
TEXTML Administration shortcut on the
tool bar. If the shortcut is not displayed, follow these steps:
Select Window > Perspective > Open Perspective > Other
Click TEXTML
Administration.
Click Open.
In the TEXTML
Administration view, double-click the server. If your server is
not displayed in the view, you must add it to the view.
When the Connect as dialog
opens, type your username and password and click OK.
Double-click the name of your Content Store to open a connection to it.
In the repository's /system/conf collection, check out one of
the following files:
map_status.xml to configure colors for the map portion of the
chart.
topic_status.xml to configure colors for the topic portion of the
chart.
image_status.xml to configure colors for the image portion of the
chart.
resource_status.xml to configure colors for the resources portion of
the chart.
Note: These files are also used
to configure the workflow used by all the documents in your Content Store, so they
should be updated with care.
Open the file with a text editor.
Locate the element for the cycle to configure.
For example, to configure the Authoring cycle, locate the Authoring
element:
Tip: There are several web sites that match colors with RGB values.
When you have configured all the states for the document object, save, close, and
check in the file.
Repeat from Step 3 to configure colors for additional document objects.
Tip: To make it easy for users to understand the pie chart, use consistent colors,
perhaps in varying shades, for each state across all document objects (for
example, blue for draft, yellow for edit/review, green for
done).
Inform users of the changes and request that they close and
reopen their IXIASOFT CCMS Desktop to apply the
changes.
To test your setup:
Open the Project Management view.
In the Project Management view, right-click a document map within a document project
and select Show statistics.