


Modernizing User Assistance
SAP uses open-source components to make content more usable and visually appealing, and to take user assistance to the next level.
Do you remember when software documentation was delivered in frozen headered and footered PDF books? Or bewildering webs of static HTML pages – the digital equivalent, but still just as static? For most of us, this is still the norm. And in the meantime, our consumers swipe their phones to board airplanes, develop apps on their iPads, and communicate with their refrigerators.
Using DITA, the DITA Open Toolkit, a dash of video and a touch of Javascript, SAP is bringing static product documentation into the amazing world of dynamic user assistance, with interactive image maps, embedded YouTube videos, and tables you can filter and sort, with checkable rows. It may be just a beginning, but it’s a first step toward bringing user assistance into the 21st century.
Visual Navigation with Image Maps
Would you rather read Geo Magazine or a phone book? Likewise, when you’re trying to find technical information about a software component, would you rather wade through tiers of link lists, or click on the component in a diagram that puts all the parts in context?
Image maps are graphics with hyperlinks that permit jumping to related or more specific information from a visual overview. They’re particularly suited to architectural diagrams, process flows, geographical distribution, or information concerning sets of objects (a commercial offering, a simple table of contents, the parts of an engine…).
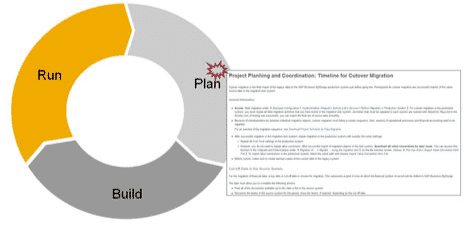
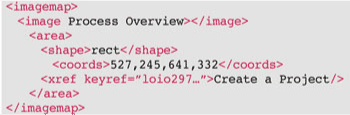
Figure 1: Simple image map with clickable areas
Basic image maps are supported in standard DITA, but you need to determine the image’s clickable area first, using a tool like SnagIt!, GIMP, or image-maps.com. These tools allow you to obtain the coordinates for rectangular, circular, or polygonal areas. These areas aren’t visible in the final output, but correspond roughly to shapes within the graphic. Next, create the image map in your DITA topic:
- Insert the image, as you would normally.
- In the XML, enclose the <image> element within an <imagemap> element.
- For each clickable area, enter its shape, coordinates, and hyperlink reference:
Using the JavaScript ImageMapster jQuery plugin, for example, you can create more dynamic, “fancy” image maps with progressive disclosure. Imagine a simplified architectural diagram whose parts “light up” with details if you hover over them, and remain visible if you click on them. Hiding the diagram’s complexity, you see only what you need to see, and no more.
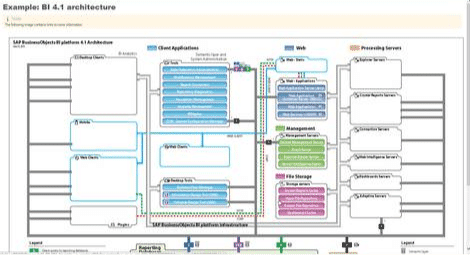
Figure 2: “Fancy” image map with interactive, progressive disclosure
Videos Embedded in DITA Topics
Videos have become the go-to format for acquiring information for entire generations of users. For technical communication, videos are particularly adapted to product overviews, or what’s new or how-to information. Captivating and multi-modal, they make information more entertaining and easier to retain.
You can embed YouTube or MP4 videos in DITA topics so that users can play them from within the user assistance itself.
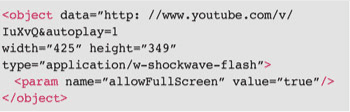
To insert a YouTube video:
- Adjust the video’s URL by replacing watch?v= with v/, then copy it.
- In your DITA topic, add the <object> element where you want the video to appear, and then inside it:
- Add the data attribute, then paste the YouTube video’s modified URL into it as its value.
- Add width, height, and type attributes to define the dimensions and type of the video player.
- (Optional) If you want the video to play automatically when the user opens the topic, add autoplay=1 to the end of the video’s address
- (Recommended) To enable the user to use full-screen mode, add a <param> element with name=allowFullScreen and value=true.
Here’s some sample code:
The result looks like this:
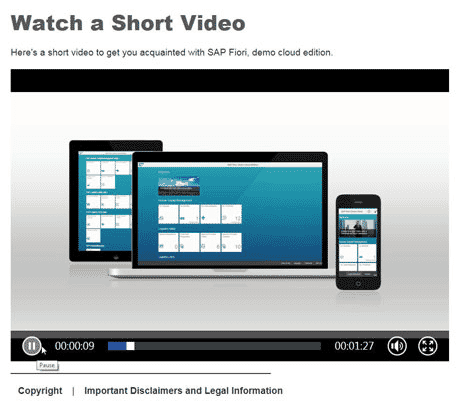
Figure 3: Embedded YouTube video
Interactive DATA Tables
Data tables make big tables easily consumable in HTML-based formats, allowing users to search, sort, filter, and even hide columns.
To turn a standard table into a data table, insert a standard table in the DITA topic, and then change the table’s @outputclass value to include the word “datatable.” For example, < table outputclass = “datatable_1 …/ >
You can create more than one data table in a topic. But if you do, each one must have a different outputclass value – it doesn’t matter what the value is, as long as it includes the word “datatable”. You can customize the data table as a whole, or just specific columns. The specific options available for this depend on the jQuery plugin you’re using, such as the DataTables plug-in for jQuery.
- To customize the entire table, add elements with the required attributes inside the table title. For example:
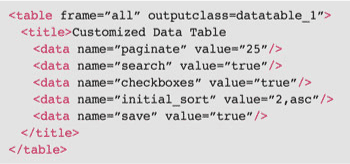
This will enable users to determine how many rows should appear in each view of the table (initially set to 25), search for specific text strings, check off particular rows, sort data, and then save their settings from one viewing to the next.
- To customize a specific table column, add data elements and attributes inside the column’s header entry to enable things like sorting, filtering or hiding. Some sample code:
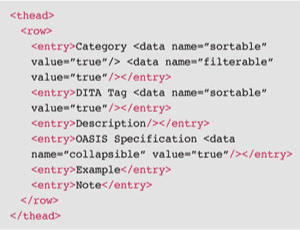
Figure 4 shows what the result looks like.
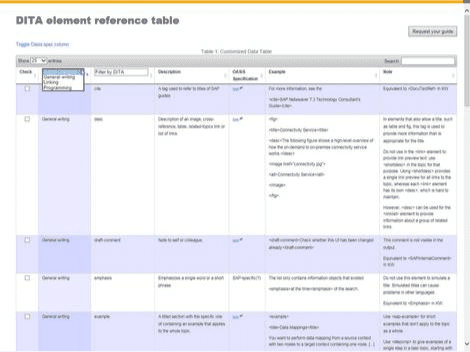
Figure 4: Dynamic data table
In this DITA element reference table, beyond searching, sorting, and filtering, you can collapse the column containing links to the OASIS specification for each element, a good way for more experienced DITA users to free up space on screen. You can also check the elements you’re particularly interested in, a potential basis for the on-demand generation of a custom PDF. Imagine how useful this could be if applied to a table of contents, a list of the deliverables in a product’s documentation set, or an API reference. Users could produce slimmed-down outputs (PDFs, CHM, Eclipse…) with the information that’s most valuable to them, without having to wade through the rest.
Modern, Interactive Outputs
Today SAP supports about a dozen standard output formats, such as PDF, Eclipse, and a variety of HTML-based outputs and variants – to cater in particular to cloud software in which the integrated Help must have the precise look and feel of the software. Combining the DITA Open Toolkit with JavaScript and HTML5 can result in modern, elegant outputs that are easy to use, and easy on the eyes. Figure 5 shows an example of our cookbook format.
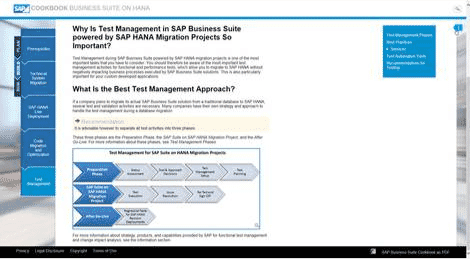
Figure 5: SAP Business Suite on HANA Cookbook
This graphical interface allows users to drill down into any phase of a migration project for more information, without ever losing track of where they are in the overall process.
- The migration process (Plan, Build, Run) is always displayed to the far left, and your current position is highlighted.
- As you dive into more detailed information, each level of information is displayed in a collapsible column to the left, with child topics displayed to the right. If you don’t want to navigate, search is always available.
- Related information is available from the blue i arrow at the top right of the frame, so that you can easily see if another information source is more suited to your needs, before you get down to the bottom of the page.
First Steps in Ambitious Roadmap
These are just some of the initial steps SAP has been taking as part of an ongoing process of modernizing its user assistance. Progressively, we are “industrializing” what used to be manual proof-of-concepts, by integrating the required JavaScript into our automated production processes, and adapting our DTDs. This allows incorporating these more advanced features into standard practice, and provides more control over their precise functionality from the source files themselves. We are also re-architecting all our HTML-based formats to the cleaner, simpler and highly configurable HTML5, so that you can obtain different-looking outputs from the same output type. In addition, HTML5’s layouts adapt to just about any screen size, essential in today’s exponentially increasing use of mobile devices. Other major axes of our modernization roadmap include:
- Radical simplification of user assistance, in line with the simplification of our software
- Contextualized user assistance that fits the software, the task, and the user
- Community and collaboration
- Constant content refresh and enhancement, including the dynamic provisioning of hotspots in the software’s user interface
- Rich multimedia, for a varied and dynamic learning experience
In an era characterized by a rapid evolution in technology and its widespread incorporation in people’s lives, user assistance mustn’t be left behind. It’s no longer a choice, but a responsibility.

About the Author
Keith Schengili-Roberts
Senior DITA Content Strategist on the MadCap IXIA CCMS team