


What are production metrics, and why should we measure them?
In a nutshell, production metrics provide the ability to:
1. Set more accurate project estimates
Good from a project management standpoint
2. Justify need for more resources (tools/people)
Production metrics make it much easier to make effective arguments to upper-management as to future resource needs, based on previous performance
3. Understand quality of production
Combined with any quality measurements you may be using, production metrics give you a chance to quantitatively measure how consistent your quality measurements are
4. An opportunity to measure value
How often do people download or reference your content? Do they do so before making a purchase? Feedback on your published content is important.
5. DITA metrics can be used to guide managers, information architects, and writers on how to improve content
The “atomic” nature of DITA content lends itself well to measurement, and can provide guidance on how content can be improved.
Comparing Reuse Across Maps:
- One possible method: compare two or more maps and see what they have in terms of child elements, such as the topics and images
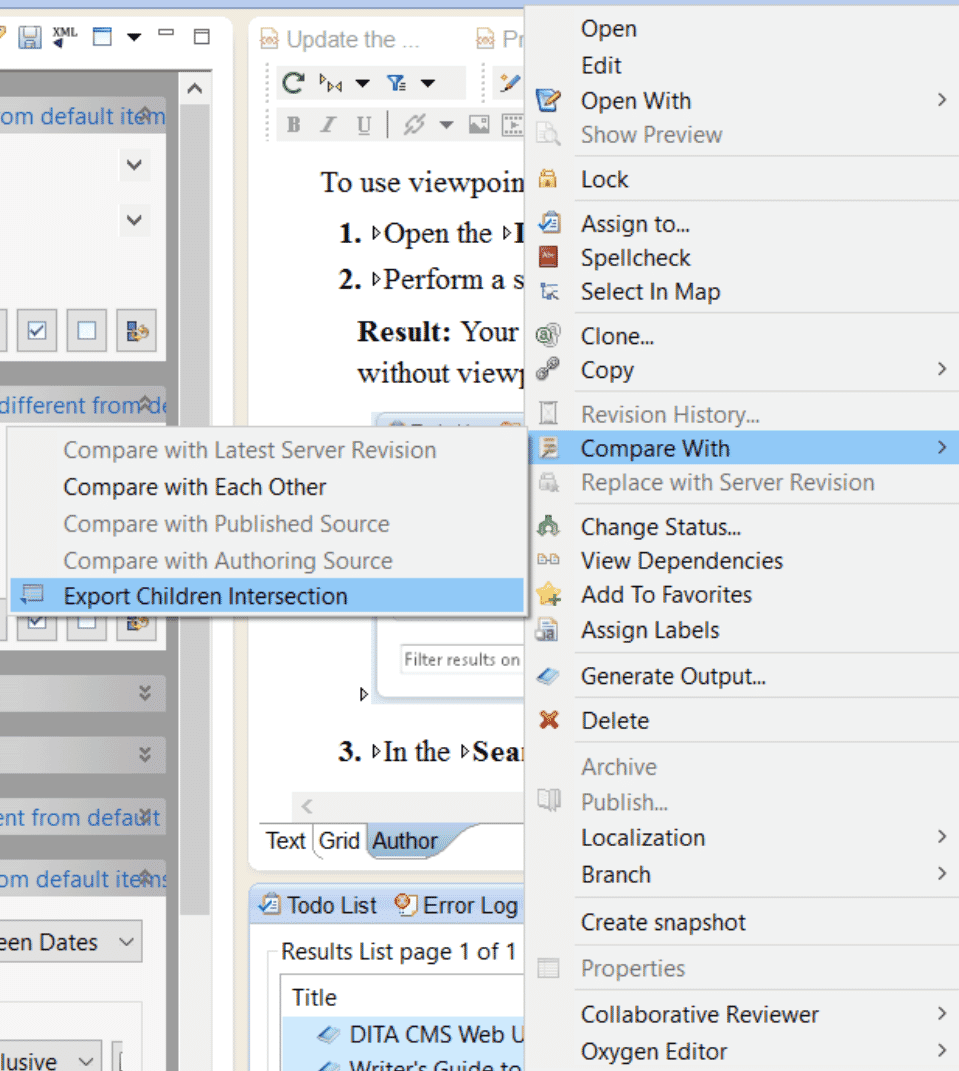
- MadCap IXIA CCMS has a feature that automates this process: select two maps you want to compare, right-click and select Compare With > Export Children Intersection
- This outputs a file that shows all matching and non-matching
objects in those two maps
What does “export children” do?
Export children launches a process that checks the unique filenames of the topics within the primary map against any that also appear in the secondary map(s). Results can then be exported for use within Excel.
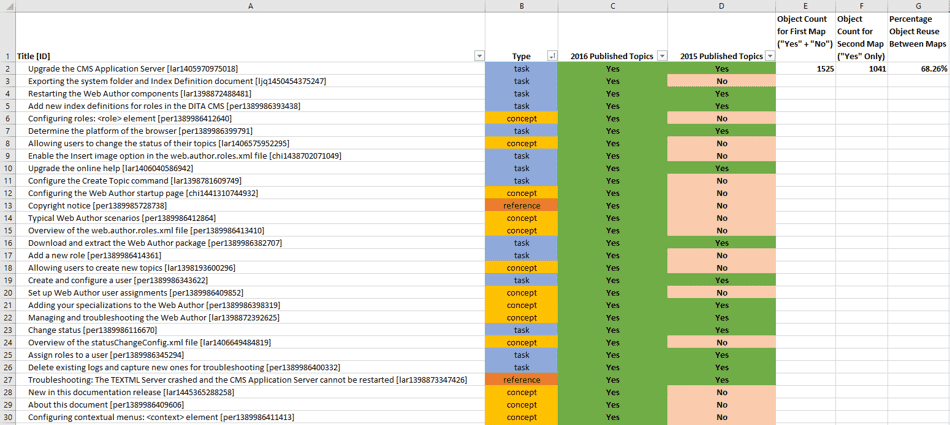
It contains:
- Titles and IDs of topics, images, and conrefs contained within the original source map, as well as those that exist in the secondary maps that are not contained within the original source map
- Topic type or object type identified
- Authoring revision of a topic/object from the source map and its equivalent in the target map (where it exists)
- An indicator that there is a match for the topic or object
Note that this process looks at topic/object-level reuse; conrefs are not included directly in the analysis. Having said that, our documentation group follows best practices and uses known as conref “warehouses” that share commonly-used paragraphs and phrases. This way, conrefs use can be accounted for separately.
Comparing Reuse Metrics for MadCap IXIA CCMS Docs (2015-2016)
To compare the product of all content between Jan 1-Dec 31 for each year, a search was done on all content created/modified between those dates for both years, and then dropped into two separate maps—one for each year’s worth of content.
Below is the 2015/2016 data, since in 2017 IXIA CCMS underwent a major overhaul of its docs. Compared to other software firms that are using DITA, the following reuse rate numbers are fairly typical.
The Results
The funnel chart provides a good visual representation of the differences. Let’s take a quick look at what’s here:
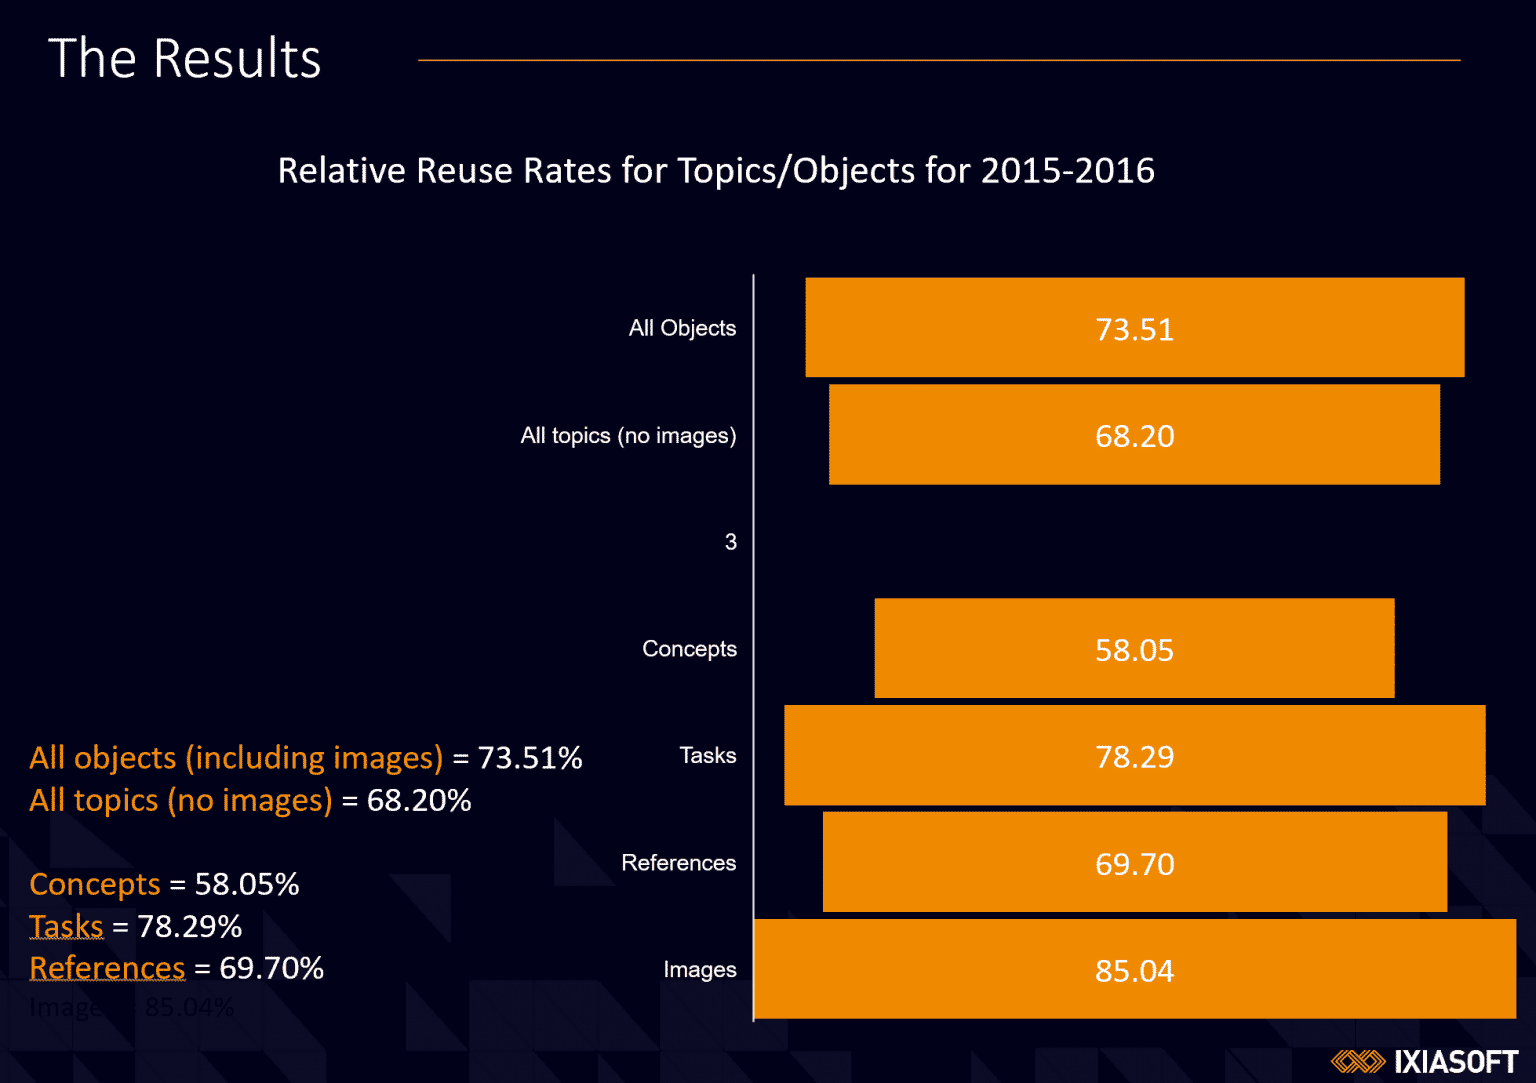
Overall reuse rates are good—as much as 74% percent (rounded up)—but that’s if you are including images. How important are things like images in terms of “useful” reuse measurements? It is useful if we’re talking about technical diagrams, but if we are talking about company logos or other things that are used often, you can see how that might skew things. If you take images out of the mix, we get a 68% reuse rate; which is likely closer to what would be considered to be “useful.”
IXIASOFT is a software company, so it makes sense that we get a more reuse for things like tasks, and less for things like concepts. Our products share a lot of procedural information, while the conceptual information tends to be specific to the product.
Are images skewing reuse rates?
Note that images skewing reuse rates is specific to the IXIA CCMS instance; you may not have this same issue. This example provides an idea as to what to look for in your DITA production metrics, and not to necessarily take things at face value, but to delve deeper, and to assess what is important for you to measure.
The Children Intersection feature is not the only way to measure reuse, but it can provide a rough idea of reuse rates quickly. IXIASOFT customer Ericsson wanted to go one step further in this process, and devise a Key Performance Indicator (KPI) reuse metric that could be used across the company.